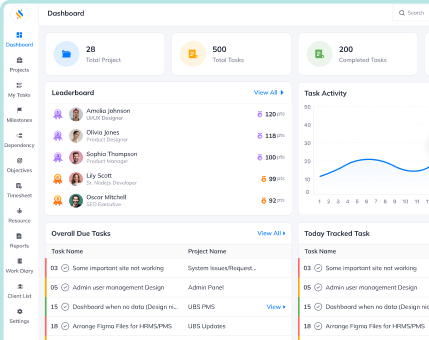
Access 16+ Actionable Reports
Through every report update, once project data is organized, you can explore it more deeply to enhance efficiency and optimize workflows. Stay on top of time, cost, and progress—all from one reporting hub.
An all-in-one business management solution for all your business needs!
Book a free demo to know more!
Built to scale with your business.
AI-powered solution to automate workflow.
Cost-effective for growing businesses.


An all-in-one business management solution for all your business needs!
Book a free demo to know more!


A smart solution to keep all your projects on track.
Stay aligned, meet deadlines, and move projects forward with Super Project.

A smart solution to keep all your projects on track.
Stay aligned, meet deadlines, and move projects forward with Super Project.
Hear how businesses across industries are transforming the way they work with Superworks
We are here to help you find a solution that suits your business need.
Charts and reports are two of the great features of Super Project that represent a time sheet and project data, their timelines, and even progress. They help in tracking tasks, managing resources, and ensuring that projects stay on schedule.
They provide clarity and transparency, allowing teams to monitor progress, identify bottlenecks, and make informed decisions to keep projects on track.
Common project management charts include Gantt charts for scheduling, Kanban boards for workflow visualization, and burndown charts for tracking work remaining in a sprint. The Super Project, a fine product of Superworks, as well-known HRMS and payroll software, has many more such great features that can help you manage your projects & and even the entire workspace better, so check them out now!
Reports compile data on project performance, resource utilization, and timelines, offering insights that aid in decision-making and stakeholder communication.
Yes, most project management tools Super Project, a well-known project management software, allow customization of charts and reports to fit the specific needs and metrics of different projects.